The heart to give, The heart to share|JTC Inc.
![]()
toggle navigation
- HOME
- Investor Relations
- Financial Highlight(non-consolidated)
Financial Highlight
Financial Highlights(IFRS)
Unit: Million Yen
| Feb. 2022 | Feb. 2023 | Feb. 2024 | |
|---|---|---|---|
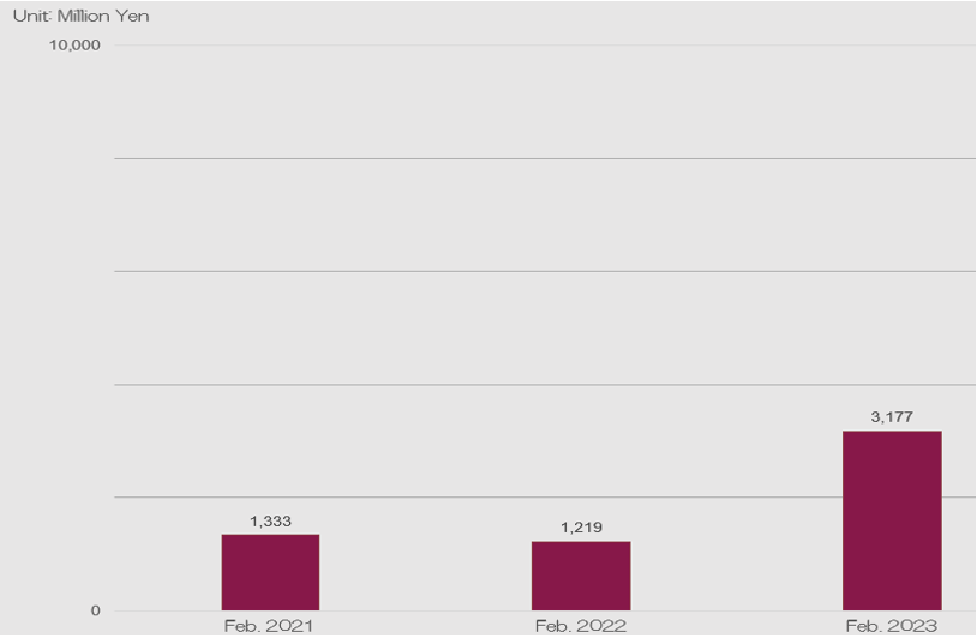
| Sales | 1,219 | 3,177 | 15,961 |
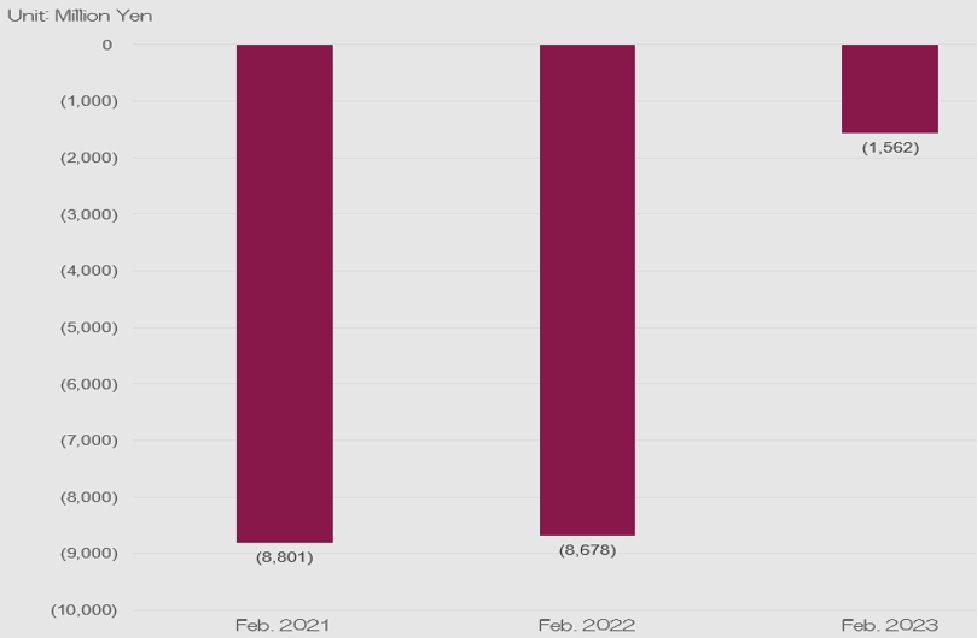
| Operating Profit | (8,678) | (1,562) | 2,028 |
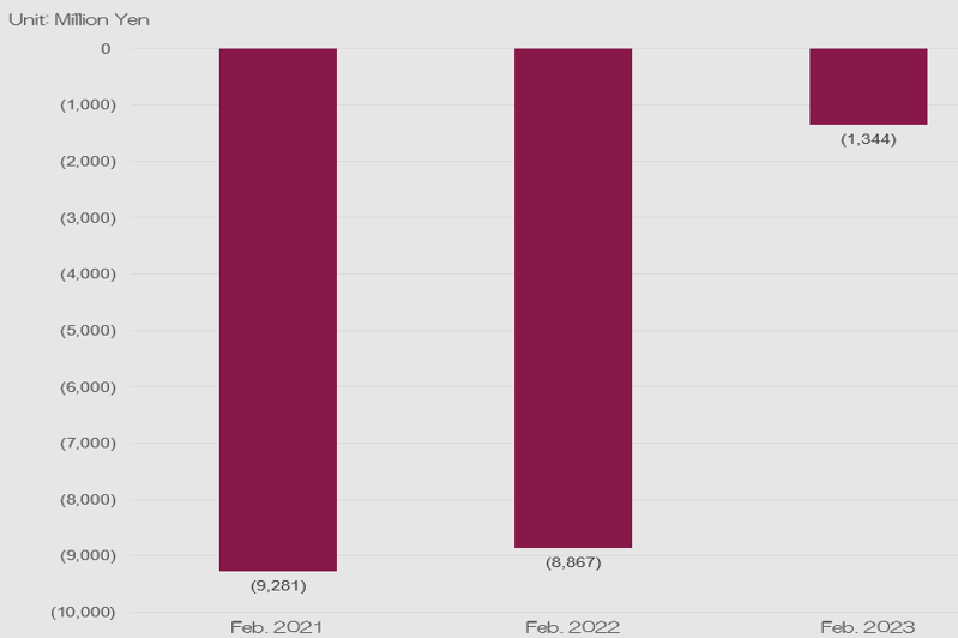
| Net Income | (8,867) | (1,344) | 2,245 |
| Total Assets | 25,288 | 26,828 | 29,338 |
| Owner's Equity | 3,299 | 7,255 | 9,477 |
| Operating Profit Ratio | - | - | 12.7% |
| Net Income Ratio | - | - | 14.1% |
| Return on Assets | - | - | 7.7% |
| Return on Equity | - | - | 23.7% |
| Equity to Asset Ratio | 13.0% | 27.0% | 32.3% |
| Earnings per Share | (253)Yen | (36)Yen | 45Yen |
-
Sales
-
Operating Income・Operating Income Ratio
-
Net Income・Net Income Ratio
※The following graphs are based on International Financial Reporting Standards (IFRS).