The heart to give, The heart to share|JTC Inc.
![]()
toggle navigation
- HOME
- Investor Relations
- Financial Highlight(Consolidated)
Financial Highlight
Financial Highlights(IFRS)
Unit: Million Yen
| Feb. 2022 | Feb. 2023 | Feb. 2024 | |
|---|---|---|---|
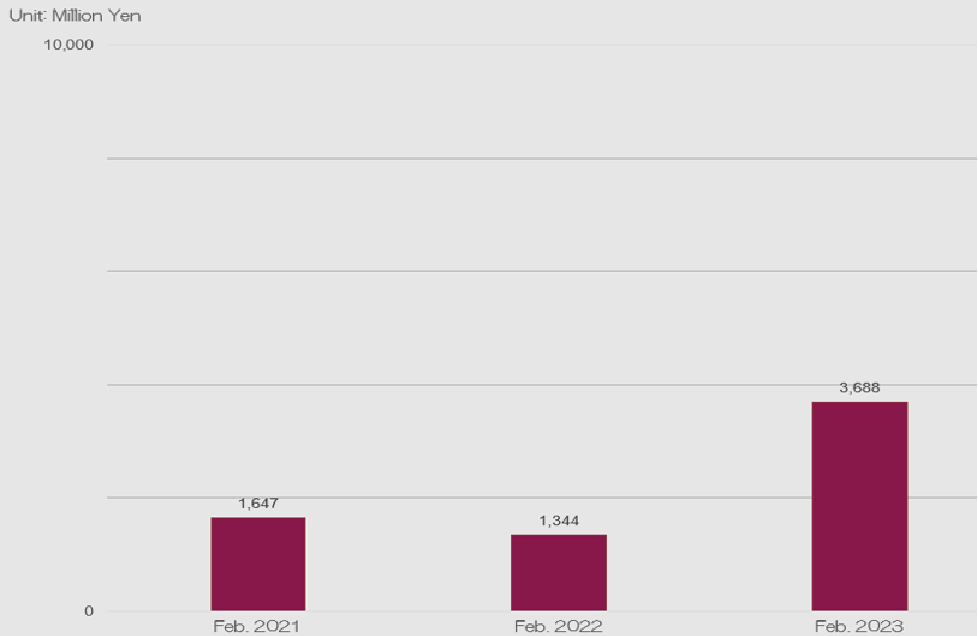
| Sales | 1,345 | 3,688 | 16,268 |
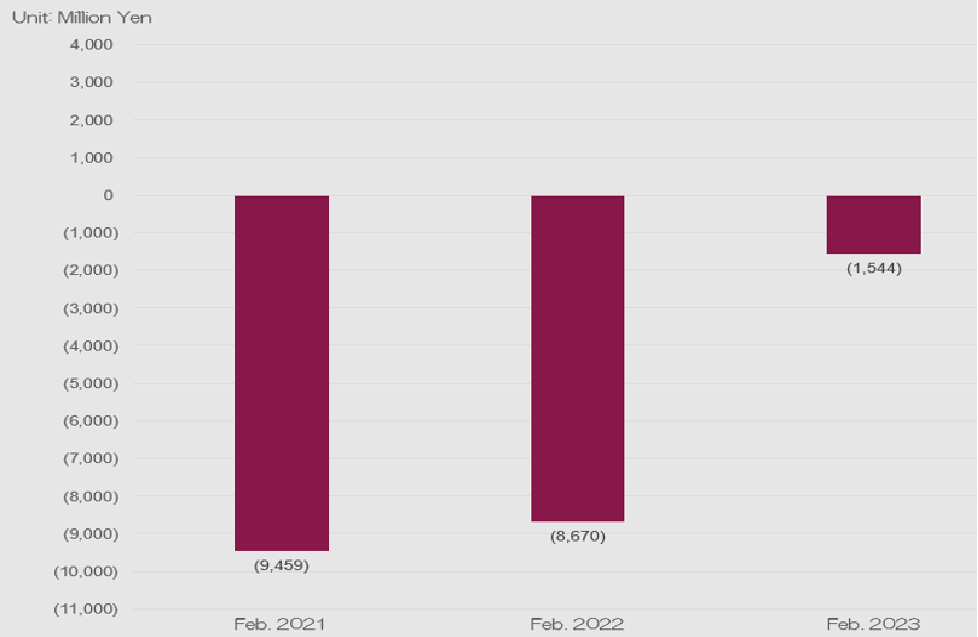
| Operating Profit | (8,670) | (1,544) | 2,375 |
| Net Income (※1) | (8,850) | (1,451) | 2,218 |
| Total Assets | 25,990 | 27,435 | 29,736 |
| Owner's Equity (※2) | 3,274 | 7,208 | 9,649 |
| Operating Profit Ratio | - | - | 14.6% |
| Net Income Ratio | - | - | 13.6% |
| Return on Assets | - | - | 7.5% |
| Return on Equity | - | - | 23.0% |
| Equity to Asset Ratio | 12.6% | 26.3% | 32.4% |
| Earnings per Share | (253)Yen | (38)Yen | 44Yen |
Our group has adopted the system of consolidated accounting since the fiscal year ending in February 2019.
※1.Net Income(Net Income on company's controlling Equity)
※2.Excluding non-controlling interest, if the company is a controlling company or holding company
-
Sales
-
Operating Income・Operating Income Ratio
-
Net Income (Net Income on controlling company's Equity)・
Net Income Ratio (Net Income on controlling company's Equity)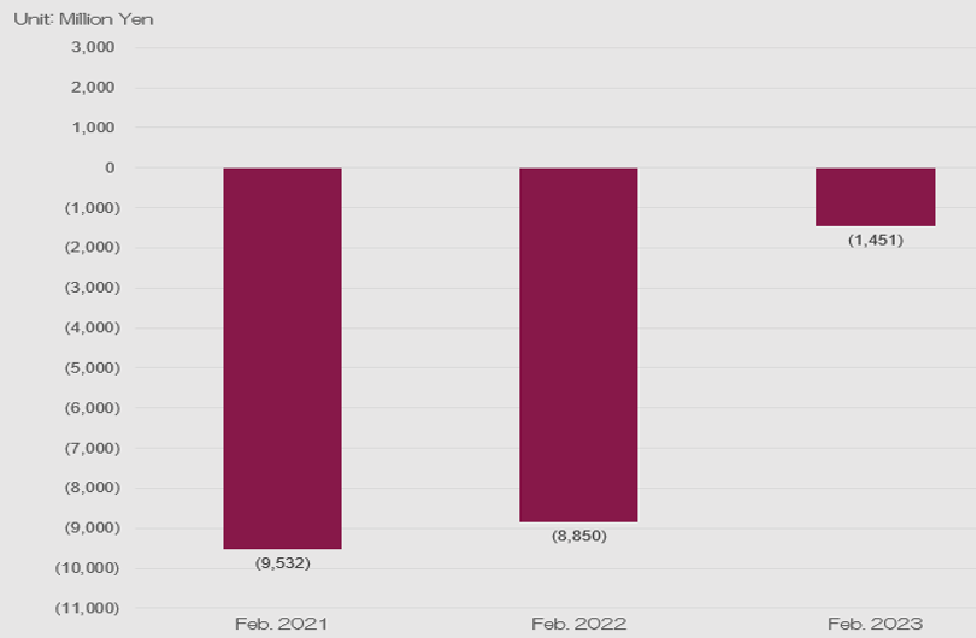
※The following graphs are based on International Financial Reporting Standards (IFRS).